|
SQL 2008 tagged blogs
| SQL 2008 Discovering Database Deadlocks |  |
|---|
|
-12th January 2013
Discovering database deadlocks and how to fix them:
First of all, it is worth mentioning that SQL 2008 monitors locks in the database and resolves them automatically. If you however would like to investigate locking further, detect theyr presence, or suspect a lock for not being properly handeled by MS SQL, then the following steps can be taken:
1. Open a new query window and execute the following query:
SELECT session_id, blocking_session_id
FROM sys.dm_exec_requests
WHERE blocking_session_id > 0
|
2. If a lock is found, the results should look something similar to the following:
3. To identify the processes and the user running them, execute:
sp_who2 'processnumber'
For instance: sp_who2 52 |
The result may yield:
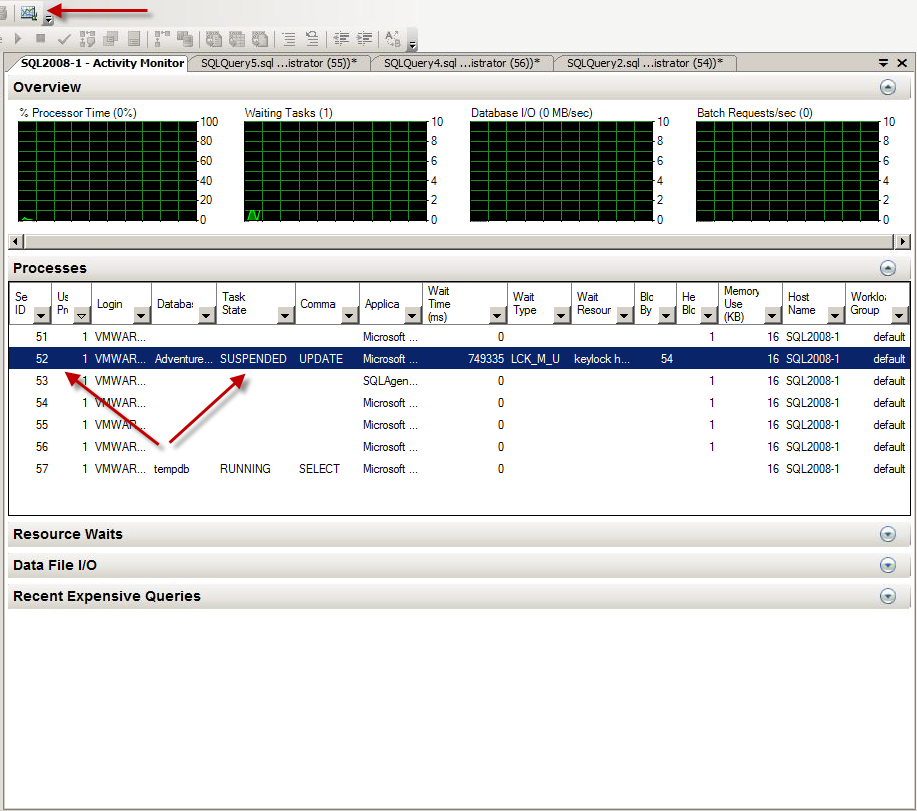
4. The conflicting process can also be found in Activity Monitor:
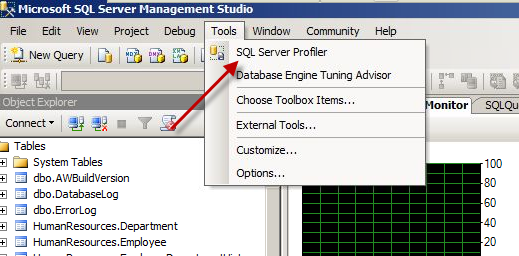
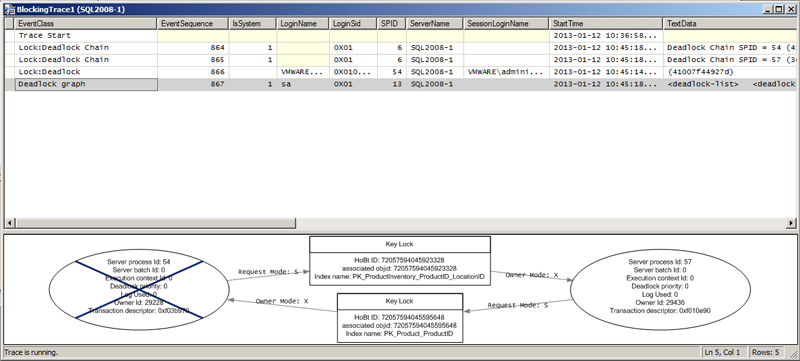
5. SQL Profiler can also be used to detect a deadlock:
5a. Start Profiler and select a new trace:
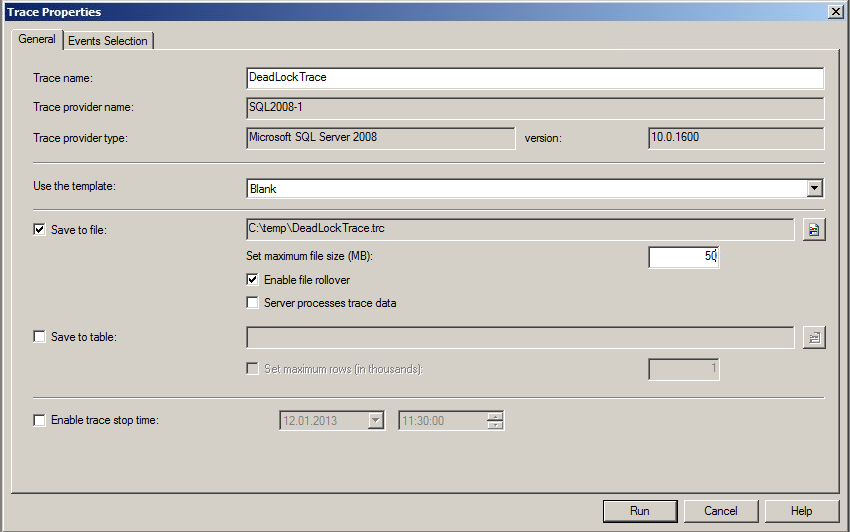
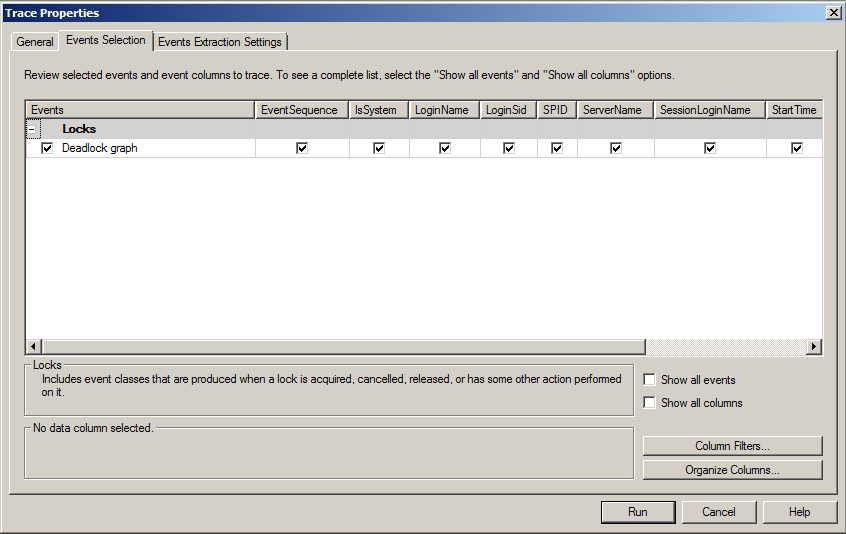
5b. Setup the trace as shown pictured below(both the 'General' tab and the 'Events Selection' tab):
5c. Press Run
5d. View the deadlock in SQL profiler:
6. The processes can be dealt with by issuing the kill kommand in the query window:
Kill 'processnumber'
For instance: kill 52 |
For more information on deadlocking, this article might be of interest.
Sources: SQL 2008 Administration. ISBN: 978-0-470-55420-3
Microsoft SQL Server 2008 - Implementation and Maintenance. ISBN-13: 978-0-7356-2605-8
Tagged as: SQL 2008, HowTo |
| SQL 2008 Policy Based Management | |
|---|
|
-13th of August 2011
Overview of Policy Based Management:
By using PBM in SQL 2008 you can enforce automatic evaluation, automatic enforcement, surface area configuration and centralize the management of these aspects. There by increasing effecticity and administration.
Policy based Management in SQL 2008 server is based on three components:
| Facet | - What technical area will the policy apply to?
| | Condition | - What condition of the facet do we test for?
| | Policy | - The policy that evaluates the condition of the facet and enforces what it is configured for.
|
The policy is then applied to a target wich has to be specifically defined.
More about SQL Server 2008 Policy based management.
Source: SQL 2008 Administration. ISBN: 978-0-470-55420-3
Tagged as: SQL 2008 |
| SQL 2008 Troubleshooting and Diagnosing Service Failures | |
|---|
|
-19th January 2013
Troubleshooting and Diagnosing Service Failures:
In order to troubleshoot service failures, a clear picture of what prerequisites a successfully running service needs to be made.
1. The SQL Server service account's password should not be changed directly but through SQL Server Configuration Manager. The service master key is encrypted by the service account and password, and both are only updated via the Configuration Manager.
2. Make sure the service is in the right startup mode. It should always be set to manual for clustered installations. Service start failures should be troubleshooted firstly via Event Viewer and the SQL server error logs. The location of the SQL Server error logs can be found by running the following TSQL in a query window:
|
SELECT SERVERPROPERTY(‘ErrorLogFileName’);
|
It should output something like the following:
C:\Program Files\Microsoft SQL Server\MSSQL.1\MSSQL\LOG\ERRORLOG
|
3. The SQL server service account specified to run the service must not be locked out, deleted, disabled, expired or the service set with a wrong password.
4. The SQL server service account must have read and write access to folders that hold data/log files and system databases, R/W permissions to SQL server registry keys, have Log on As Service authority, and Sysadmin authority inside the SQL Server instance.
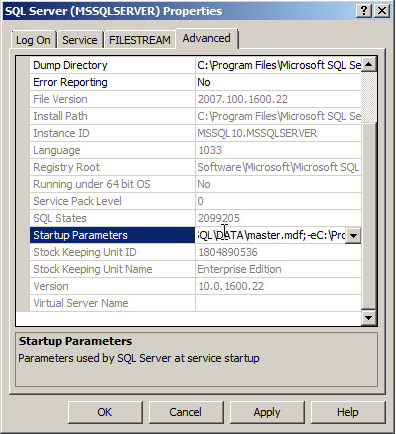
5. The storage system holding the system databases must be online, the folder holding the system database exist and path to it has to be correct. Check the service in configuration manager to see what startup parameters it is configured with. This will tell you where the system databases are placed, an thus where to check paths and permissions.
6. The Master database for the instance must not be corrupt. It can be repaired via the SQL server setup -> Maintenance Page -> Repair Wizard. The Master database can be checked with the TSQL command DBCC CHECKDB.
|
|
PS. If your instance is up and running and you want to list the placement of all its databases for troubleshooting theyr location, then the following SQL Query might be of use:
|
SELECT DB_NAME(dbid),* FROM sys.sysaltfiles;
|
Sources: SQL 2008 Administration. ISBN: 978-0-470-55420-3
Tagged as: SQL 2008, HowTo |
| SQL 2008 How to trunc a log file | |
|---|
|
-23rd July 2013
How to truncate a log file with TSQL:
Every once in a while log files can grow too large and need to be truncated and/or shrinked in order to save valuable disk space. The steps below will guide you, given that you know the database name and log name. These can be found via the database properties and then selecting "Files."
Normally, taking transaction log backups will truncate the transaction log. The space used on the disk will not shrink, but more space inside the log file is freed to be available for future use. Transaction logs should be handled as a part of the backup routine. To actually shrink the log file, the steps below will make that happen.
1. The following code will set TestDb to simple recovery mode, then shrink it, and finally set it back to full recovery mode:
USE [TestDb]
GO
ALTER DATABASE [TestDb] SET RECOVERY SIMPLE WITH NO_WAIT
DBCC SHRINKFILE(TestDbLog, 1)
ALTER DATABASE [TestDb] SET RECOVERY FULL WITH NO_WAIT
GO
|
2a. To list the placement of all instance databases for viewing, then the following SQL query might be of use:
|
SELECT DB_NAME(dbid),* FROM sys.sysaltfiles;
|
2b. Alternatively, this query wich also lists all the instance log file locations might be of use:
|
SELECT name, physical_name AS current_file_location FROM sys.master_files;
|
|
|
Source: N/A
Tagged as: SQL 2008, Scripts, HowTo |
| SQL 2008 Useful TSQL queries | |
|---|
|
-19th of October 2013
Below is a collection of TSQL queries that I find useful. The list will be updated when seen appropriate.
| List all files in all databases in current instance: |
|---|
SELECT name, physical_name AS current_file_location
FROM sys.master_files;
|
| Find what database a given mdf file belongs to: |
|---|
SELECT name FROM master..sysdatabases
WHERE filename LIKE '%your_mdf_file%';
|
| Find the size of a given database: |
|---|
SELECT DB_NAME(database_id) AS DatabaseName,
Name AS Logical_Name,
Physical_Name, (size*8)/1024 SizeMB
FROM sys.master_files
WHERE DB_NAME(database_id) = 'AdventureWorks'
GO
|
|
| Find how long the current instance has been up: |
|---|
SELECT login_time FROM sys.dm_exec_sessions
WHERE session_id = 1;
|
| Find what database a given mdf file belongs to: |
|---|
SELECT name FROM master..sysdatabases
WHERE filename LIKE '%your_mdf_file%';
|
| Kill the most CPU intensive process: |
|---|
SELECT * FROM sys.dm_exec_requests
ORDER BY cpu_time DESC;
The process on the top of the list has session_id 9,
thus we kill session_id 9.
KILL 9;
|
|
Source: Useful stuff
Tagged as: SQL 2008, Scripts |
| SQL 2008 How to reset lost SA account password | |
|---|
|
-19th of October 2013
Here is an easy to follow guide on how to reset a lost SA account password in Microsoft SQL Server:
1. Stop SQL Service: on the command line type: net stop MSSQLServer
2. Start the SQL Server in Management mode: on the command line type: net start MSSQLServer /m
3. Open the SQL Server management studio, cancel the login dialog
4. Open new sql server engine query window: from the menu, Click file->new->Database engine query
5. Enable SA account if not enabled: in the query window type: Alter login sa enable
6. Set the password of the sa account: alter login sa with password='my password'
7. Stop the SQL server from the command line: net stop MSSQlServer
8. Start SQL Service from the command line: net start mssqlserver
9. Start the SQL Management studio and connect to the server using sa account
10. Add you domain administrator as sysadmin
11. Disable the sa account when you finish
Source: Useful stuff
Tagged as: SQL 2008, HowTo |
| SQL 2008 Performing an SQL Server Performance Trace | |
|---|
					/****************************************************/
					/* Created by: SQL Server 2008 R2 Profiler          */
					/****************************************************/

					-- Create a Queue
					declare @rc int
					declare @TraceID int
					declare @maxfilesize bigint
					set @maxfilesize = 500

					-- Please replace the text InsertFileNameHere, with an appropriate
					-- filename prefixed by a path, e.g., c:\MyFolder\MyTrace. The .trc extension
					-- will be appended to the filename automatically. If you are writing from
					-- remote server to local drive, please use UNC path and make sure server has
					-- write access to your network share

					exec @rc = sp_trace_create @TraceID output, 0, N'F:\MSSQL\InsertFileNameHere', @maxfilesize, NULL
					if (@rc != 0) goto error

					-- Client side File and Table cannot be scripted

					-- Set the events
					declare @on bit
					set @on = 1
					exec sp_trace_setevent @TraceID, 10, 1, @on
					exec sp_trace_setevent @TraceID, 10, 3, @on
					exec sp_trace_setevent @TraceID, 10, 11, @on
					exec sp_trace_setevent @TraceID, 10, 35, @on
					exec sp_trace_setevent @TraceID, 10, 12, @on
					exec sp_trace_setevent @TraceID, 10, 13, @on
					exec sp_trace_setevent @TraceID, 45, 1, @on
					exec sp_trace_setevent @TraceID, 45, 3, @on
					exec sp_trace_setevent @TraceID, 45, 11, @on
					exec sp_trace_setevent @TraceID, 45, 35, @on
					exec sp_trace_setevent @TraceID, 45, 12, @on
					exec sp_trace_setevent @TraceID, 45, 28, @on
					exec sp_trace_setevent @TraceID, 45, 13, @on
					exec sp_trace_setevent @TraceID, 12, 1, @on
					exec sp_trace_setevent @TraceID, 12, 3, @on
					exec sp_trace_setevent @TraceID, 12, 11, @on
					exec sp_trace_setevent @TraceID, 12, 35, @on
					exec sp_trace_setevent @TraceID, 12, 12, @on
					exec sp_trace_setevent @TraceID, 12, 13, @on


					-- Set the Filters
					declare @intfilter int
					declare @bigintfilter bigint

					set @bigintfilter = 50000
					exec sp_trace_setfilter @TraceID, 13, 0, 4, @bigintfilter

					exec sp_trace_setfilter @TraceID, 35, 0, 6, N'tmsng'
					-- Set the trace status to start
					exec sp_trace_setstatus @TraceID, 1

					-- display trace id for future references
					select TraceID=@TraceID
					goto finish

					error:
					select ErrorCode=@rc

					finish:
					go
|
					-- To stop the trace, here with Id 2:
					exec sp_trace_setstatus 2, 0
					-- To find traceID if is unknown:
					-- SELECT traceid FROM fn_trace_getinfo(default)
					--				where traceid > 1
|
				-- To deleta a trace race:
				exec sp_trace_setstatus 2, 2
				-- To delete the trace you first have to stop it.
				-- This will close the trace file being written to.
|
				-- As an alternative to the above commands the
				-- 		following code will also work:
				declare @tracenr int
				SELECT @tracenr = MAX(traceid)
					FROM fn_trace_getinfo(default) where traceid > 1
				exec sp_trace_setstatus @tracenr, 0
				exec sp_trace_setstatus @tracenr, 2
|
Firstly we need start our trace and store the results in a file that we can analyze later. Use the script on the left hand side created by SQL Server 2008 R2 Profiler and change the path and filename in 'InsertFileNameHere' to a real path on your system. You can run it in SQL Server Management Studio, this will start the trace that collects the data we need. See comments in the script for further instructions.
Let the trace run for a day or two, or at least a few hours where you know the system is under strain. To stop the trace use the stored procedure shown in the first box at the top of this column on the right hand side. The trace Id was returned to you when you started the trace, but if you have forgotten or missed it, you will find a query to find it for you in the same box at the top of this column.
When you are all done, it might be a good idea to clean up after yourself and delete the trace you created from the system. You will find commands to do that in the second box fron the top in this column. Alternatively you can use the code in the third box from the top of this column to make your day.
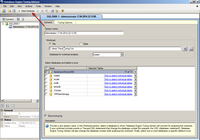
Now that you have your data collected in the trace file you created, you can start Database Engine Tuning Advisor and load the trace in there for analysis. Specify the file name and the database you want to evaluate as shown in figure 1, and start the analysis with the "Start Analysis" button.
Figure 1:
|
This blog article will be updated later with more information on Database Engine Tuning Advisor and how to use it with what you have seen so far. In the meanwhile, you are off to a start with this small guide. The next steps should be intuitive. For a closer look take a look at Ken Lassesen's guide and jump down to the "Apply the Recommendations" section. You have already performed all the rest above that section when reading and following this guide, thus simplifying the process of doing this greatly.
|
Sources: Gurus at my work
Tagged as: Scripts, SQL 2008 |
|